Quick Facts
- Market Pattern: Bear Flattening (front-end yields rising faster than long-end)
- Geopolitical Trigger: 8-week closure of the Strait of Hormuz in 2026
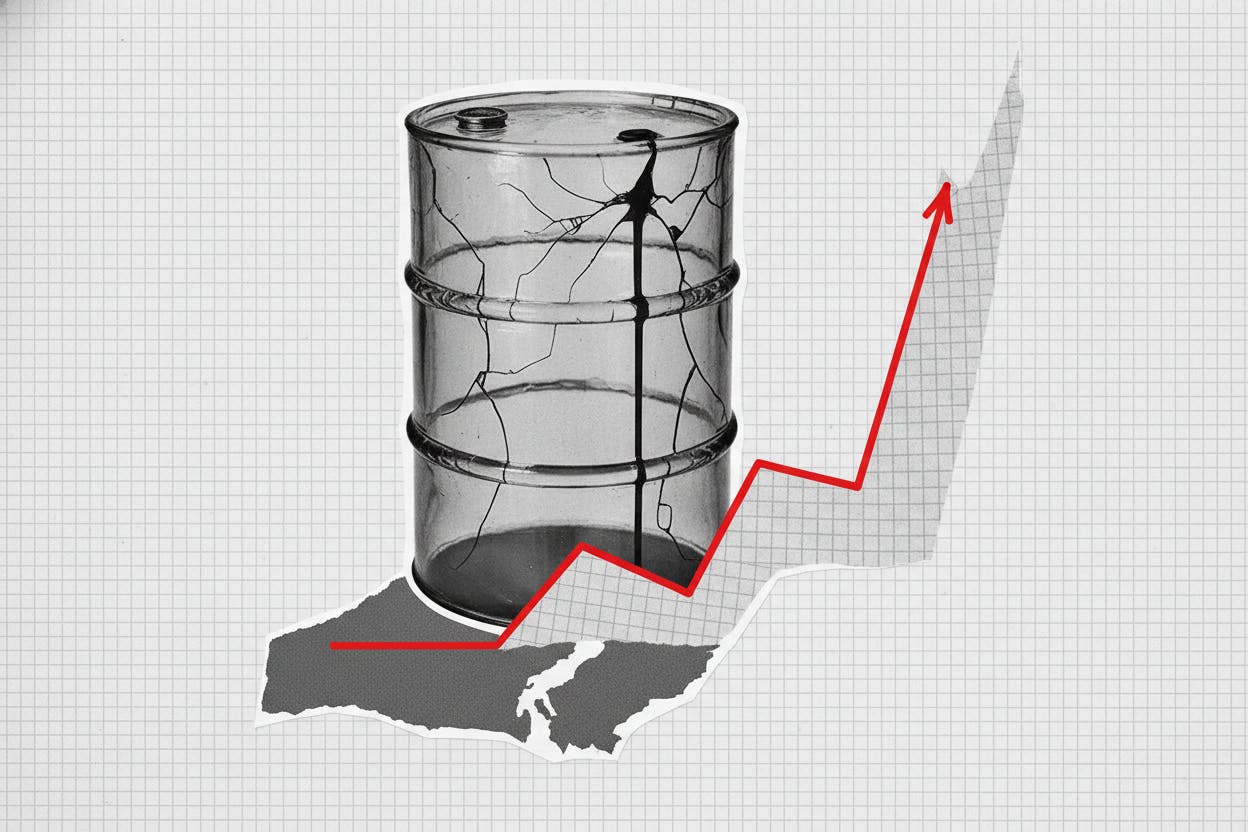
- Energy Asset: Brent crude touched $138 per barrel during the April peak
- Yield Extremes: 30-year Treasury at 4.91%, reaching the 94th percentile
- FX Pressure: USD/KRW reached 1,503 target levels amid yield shifts
- Consumer Health: Sentiment dropped to 49.8 despite historical equity highs
The 2026 bond market is being redefined by a bear flattening curve as geopolitical volatility in the Strait of Hormuz drives an energy price shock. With the front end of the yield curve rising faster than the long end, investors must navigate hawkish monetary policy and rising currency hedging costs. A bear flattening curve occurs when short-term interest rates rise faster than long-term yields, typically driven by expectations of a more hawkish monetary policy or immediate inflationary shocks. In the context of geopolitical tensions in the Strait of Hormuz, rising energy prices often prompt central banks to keep interest rates higher for longer. This shift causes the front end of the yield curve to rise as investors price in persistent inflation and a tighter financial environment, leading to a narrowing spread between short and long-term debt.
The Hormuz Catalyst: Why the Curve is Flattening
The current fixed income environment is dictated by the logistical reality of the energy markets. In early 2026, the US Treasury yield curve experienced a bear-flattening pattern where the 2-year Treasury yield rose by 32 basis points, significantly outperforming the 10-year and 30-year yields which increased by only 12 and 4 basis points, respectively. This non-parallel shift in the yield curve is the hallmark of a bear flattener, where the "bearish" sell-off in bonds is concentrated in the short-term maturities.
The catalyst for this shift is rooted in global logistics. During the peak of the Strait of Hormuz tensions in April 2026, Brent crude oil prices reached a high of $138 per barrel as the closure disrupted a waterway that typically handles approximately 20% to 25% of the world's seaborne oil trade. When energy costs spike so aggressively, they create an immediate cost-push inflation effect. For central banks, particularly the Federal Reserve, this necessitates a hawkish monetary policy to prevent inflationary expectations from becoming unanchored. Consequently, the market prices in a higher for longer interest rate path, aggressively lifting front-end rate sensitivity while the long end of the curve—representing long-term growth expectations—remains relatively anchored or rises more slowly.
| Metric | April 2026 Peak | 5-Year Percentile | Historical Benchmark (Avg) |
|---|---|---|---|
| 2-Year Treasury Yield | 5.08% | 96th | 2.45% |
| 10-Year Treasury Yield | 4.30% | 79th | 3.10% |
| 30-Year Treasury Yield | 4.91% | 94th | 3.50% |
| Brent Crude Oil | $138/bbl | 98th | $78/bbl |
Interpreting bear flattening signals for energy market volatility allows portfolio managers to understand that this is not a typical recessionary flattening. Unlike a bull flattener, where long rates drop faster due to growth fears, the current bear flattening curve reflects a geopolitical risk premium being priced into the immediate cost of capital. By late April 2026, the 10-year Treasury yield reached 4.30%—sitting at the 79th percentile of its five-year range—amid an eight-week disruption in the Strait of Hormuz that heightened global inflation expectations. This setup forces benchmark government bonds to reprice rapidly, creating a challenging environment for fixed income investors holding short-duration debt.
Protecting emerging market portfolios from Hormuz oil shocks requires a deep dive into geopolitical tensions and bond yield correlations. As short-term rates climb, the discount factor for future cash flows increases most significantly for the near term, leading to a broad fixed income sell-off.
The Hidden Cost: Currency Hedging & EM Risk
The transition to a bear flattening environment significantly increases currency hedging costs for international investors. As short-term US Treasury yields rise relative to other markets, the cost of cross-currency swaps traditionally used to manage exchange rate risk becomes more expensive. This dynamic often triggers a stronger US dollar, as the widening interest rate differential attracts capital to the front end of the US curve.
The impact of bear flattening on currency hedging is particularly visible in risk-sensitive emerging market currencies. For example, during this period, USD/KRW reached critical target levels around 1,503. For an institutional investor holding South Korean assets, the cost of hedging USD KRW depreciation during yield curve flattening can erode a significant portion of the underlying asset's return. Historically, emerging market returns were driven primarily by local yields; however, in 2026, the return composition has shifted toward a more balanced 50/50 split between FX carry and local yield.
Emerging market portfolio risk management becomes a complex balancing act under these conditions. On one hand, the energy price shock benefits oil exporters like Brazil or Saudi Arabia, but the financial tightening resulting from a bear flattening curve puts immense pressure on their debt servicing costs. Meanwhile, safe-haven assets in Central Europe, such as Polish or Czech debt, may offer some stability, but they remain vulnerable to the broader global liquidity squeeze. As the US 2-year yield outpaces the 10-year, international asset managers find that the cost to protect local currency returns often exceeds the yield advantage of the EM bond itself, forcing a tactical retreat to more liquid safe-haven assets.
Portfolio Execution: Adjusting Duration and Allocation
The mechanics of a bear flattening curve require a shift from passive duration management to active curve positioning. As short-term rates rise, investors face significant bear flattening impact on short term corporate borrowing rates. Companies that rely on rolling over short-term commercial paper find their interest expenses climbing much faster than those with long-term fixed debt. Consequently, credit spreads tend to widen as the market questions the sustainability of high front-end costs for levered corporations.
Adjusting bond duration in a bear flattening environment usually involves moving away from the "belly" of the curve—the 5-to-7-year maturities—and adopting a "Barbell" strategy. This approach involves holding very short-term cash equivalents to benefit from rising front-end yields while maintaining exposure to the 30-year end of the curve to capture any eventual flight to safety or long-term growth slowdown.
- Monitor Key Rate Duration: Broad duration metrics can be misleading when the curve flattens non-parallely. Focus on sensitivity to the 2-year and 3-year points.
- Assess Maturity Profiles: Prioritize corporations with extended maturity profiles to mitigate credit spread widening in bear flattening markets.
- Tactical FX Management: If hedging costs become prohibitive, consider unhedged exposure to energy-exporting currencies that have a high correlation with Brent crude.
Using Key Rate Duration allows managers to see exactly where they are exposed as the curve shifts. Amid the Hormuz-driven energy price shock, the sensitivity of a portfolio to the 2-year Treasury rate is far more critical than its sensitivity to the 10-year. If the central bank maintains a restrictive stance due to persistent cost-push inflation, the front end will continue to suffer, even if the long end remains stable.
| Historical Energy Event | Crude Price Peak | Impact on 2Y-10Y Spread | Resulting Market Pattern |
|---|---|---|---|
| 1973 Oil Crisis | +300% | Severe Inversion | Bear Flattening |
| 1990 Gulf War | +100% | Moderate Flattening | Bear Flattening |
| 2026 Hormuz Closure | $138/bbl | -20 bps (Flattening) | Bear Flattening |
FAQ
What is a bear flattening yield curve?
A bear flattening yield curve is a market condition where short-term interest rates rise faster than long-term interest rates. This is termed "bearish" because it is typically accompanied by a sell-off in the bond market (rising yields mean falling prices), and "flattening" because the difference between short and long-term yields is shrinking.
What causes a bear flattener in the bond market?
The primary driver of a bear flattener is the market's expectation of a hawkish monetary policy response to rising inflation. In the current 2026 context, the energy price shock from the Strait of Hormuz closure forced the Federal Reserve to signal higher interest rates for a longer duration, causing front-end yields to spike.
What does a bear flattening curve indicate about interest rates?
It indicates that the market expects short-term interest rates to remain high or rise further in the near future. It suggests that the central bank is focused on combating immediate inflationary pressures, such as supply-chain disruptions, rather than being concerned about a long-term economic slowdown which would typically cause long-term rates to fall.
What happens to bond prices during a bear flattening event?
Bond prices generally fall during a bear flattening event because yields are rising across the curve. However, short-term bonds experience a more significant price decline relative to their usual volatility compared to long-term bonds, as the upward pressure on yields is most intense at the front end of the curve.
What are the risks of a bear flattening yield curve for investors?
The main risks include increased hedging costs for international portfolios, higher borrowing costs for corporations dependent on short-term debt, and potential losses for investors who are heavily weighted in short-to-medium duration fixed income. Additionally, the resulting strength in the US dollar can put pressure on emerging market domestic returns.
Conclusion: Navigating the Yield Path
Navigating the bear flattening curve of 2026 requires more than a simple understanding of interest rates; it demands a tactical view of how energy markets and geopolitics influence the cost of capital. The 8-week disruption in the Strait of Hormuz has created a environment where managing currency hedging costs during bear flattening is just as important as selecting the right credit.
As we look toward the remainder of 2026, the interest rate path remains tethered to energy price developments. If tensions ease, we may see the curve steepen as front-end yields retreat; however, as long as cost-push inflation remains a threat, the bear flattener will likely persist. For the long-term investor, the priority remains monitoring the geopolitical risk premium and adjusting the maturity profile of portfolios to withstand the higher-for-longer reality. Successful risk management today is found in the ability to bridge the gap between global macro events and the microscopic details of the yield curve spread.